Tuberculosis: Drug resistance in Canada – 2012
Table of Contents
-
APPENDIX 1: Participating Laboratories of the Canadian Tuberculosis Laboratory Surveillance System
-
APPENDIX 2: M. tuberculosis Complex Antimicrobial Susceptibility Reporting Form
Introduction
Drug-resistant strains of tuberculosis (TB) pose a serious threat to TB prevention and control efforts. In response to the growing number of global reports pointing to a rise in the prevalence of drug resistant TB, the Centre for Communicable Diseases and Infection Control (CCDIC), Public Health Agency of Canada (the Agency), in collaboration with the Canadian Tuberculosis Laboratory Technical Network (CTLTN)a and participating laboratories (representing all provinces and territories) (Appendix 1), established the Canadian Tuberculosis Laboratory Surveillance System (CTBLSS) to monitor TB drug resistance patterns in Canada.
Participating laboratories report their results on anti-tuberculous drug susceptibility testing to the Agency for every patient for whom a specimen or an isolate has been received for each calendar year. The data are verified with the reporting laboratory, compiled and analyzed, and the results are published in this report.
This report describes information on TB isolates tested within the given calendar year and is intended to report on the overall level of TB drug resistance in Canada. TB drug resistance is determined through susceptibility testing of cultures (isolates) grown from clinical specimens obtained from culture-positive TB cases. Samples submitted for drug sensitivity testing may be obtained at any time during a particular patient's TB diagnosis and/or treatment and samples from the same case may be submitted to laboratories over the course of a number of years. Therefore, the number of isolates described in this report will not be equal to the number of culture-positive cases reported through case-based surveillance during the same calendar year. A case of culture-positive tuberculosis is reported only once in the year of diagnosis but may be tested for drug resistance over the course of several years until cured or the prescribed treatment has been completed.
Methods
In Canada, a laboratory confirmed case of tuberculosis is any case with Mycobacterium tuberculosis complex demonstrated on culture, specifically M. tuberculosis, M. africanum, M. canetti M. caprae, M. microti, M. pinnipedii or M. bovis (excluding M. bovis BCG strain). To align the drug susceptibility report with the case report, the CTBLSS contains drug susceptibility test results of Mycobacterium tuberculosis (MTB) and other tuberculosis species (M. africanum, M. canetti, M. caprae, M. microti, M. pinnipedii or M. bovis). It also contains MTB complex (MTBC) isolates as laboratories report identification of isolates either at the complex level (MTBC) or at the species level. Isolates identified as Mycobacterium bovis BCG are included in the CTBLSS but are excluded from this report.
Data are collected either through manual completion of a standard reporting form (Appendix 2) or by electronic transmission. Information collected includes sex, year of birth, province/territory from which the specimen originated (province/territory of residence of patient), and province/territory where the drug susceptibility testing was performed.
Some jurisdictions perform drug testing for other provinces/territories. For first-line susceptibility testing, British Columbia tests British Columbia and Yukon isolates; Alberta tests Alberta and Northwest Territories isolates, Nova Scotia tests isolates for Nova Scotia and Prince Edward Island and Ontario tests isolates from Nunavut as well as its own. All other provinces report susceptibility results for isolates originating in their province only.
In Canada, four laboratories conduct second-line testing: the provincial labs in Alberta, Ontario, Quebec and the National Reference Centre for Mycobacteriology (NRCM) in Manitoba. The NRCM will perform the second line testing for all other provinces and territories not set up to do their own testing.
Results from cultures that grow in a given year are included in the statistics for that calendar year; otherwise the result will be reflected in the subsequent year's report. For example, if a specimen were received by the laboratory on December 20, 2012, and the culture grew MTB only in January 2013, the susceptibility test results would be reflected in the 2013 report. Every effort is made to eliminate duplicate specimen results or results from two specimens taken from the same person in a calendar year. In the event that a duplicate record is found and confirmed, only the most recent susceptibility result is included for analysis in a given year.
All isolates are routinely tested for resistance against first-line anti-tuberculosis drugs. Results in this report present resistance patterns to first-line drugs routinely tested for in Canada, typically isoniazid (INH), rifampin (RMP), pyrazinamide (PZA) and ethambutol (EMB). However, not all isolates are tested for resistance to all drugs. For example, some provinces and territories do not routinely test for PZA. Therefore, for reporting mono-resistance, the percentage of isolates showing resistance to a particular drug is expressed as the number of isolates resistant to the drug over the total number of isolates tested for sensitivity to that particular drug.
The Clinical and Laboratory Standards Institute1(CLSI),which offers practical operating guidelines that lead to consistent laboratory practices, precision, and efficient use of resources, recommends that after testing against first-line anti-tuberculosis agents, isolates found to be monoresistant to rifampin or which demonstrate resistance to any two of the first-line anti-tuberculosis drugs should be tested against a panel of second-line drugs. Where fluoroquinolones may be added to therapy for cases showing mono-resistance to INH, it is also recommended that second-line antimicrobial testing be performed. Second-line drug testing varies between jurisdictions, but typically testing is done for amikacin (AK) and kanamycin (KM), capreomycin (CM), clofazimine (CF), ethionamide (ETH), ofloxacin (OFL), moxifloxacin (MOX) para-amino salicylic acid (PAS) and rifabutin (RBT).
Patients are said to have drug-resistant TB if the strain of Mycobacterium tuberculosis causing their disease is resistant to one or more of the four first line drugs. The following resistance patterns are described in this report:
- monoresistance - defined as resistance to one of the first-line drugs (INH, RMP, EMB or PZA);
- poly-resistance (other patterns) - defined as resistance to two or more first-line drugs not including the isoniazid and rifampin combination;
- multidrug-resistant tuberculosis (MDR-TB) - defined as TB that is resistant to at least the two best first-line anti-tuberculosis drugs, isoniazid and rifampin, but which does not meet the definition of extensively drug-resistant TB (XDR-TB); and
- extensively drug-resistant TB (XDR-TB) - defined as TB that is resistant to at least the two best first-line anti-tuberculosis drugs, isoniazid and rifampin, plus resistant to second-line drugs including any fluoroquinolone, and to at least one of three injectable second-line anti-tuberculosis drugs (amikacin, capreomycin and kanamycin).
All laboratories are now performing routine susceptibility testing of MTB or MTBC to first-line anti-tuberculosis drugs using fluorometric proportion method BACTEC® 960. In 2012, four of the laboratories conducted second-line anti-tuberculosis drug testing. Table A lists the first-line and second-line anti-tuberculosis drugs and the critical concentrations in mg/L used by the participating laboratories.
Table A: Critical concentrations for routine testing of anti-tuberculosis drugs
| Anti-tuberculosis drugs | Critical Concentrations* (mg/L) BACTEC® 960 † |
Comments |
|---|---|---|
| Isoniazid (INH) | 0.1 | When resistance to INH is found to 0.1 mg/L, tests are repeated with INH 0.4mg/L to determine the level of resistance. Regardless, the isolate will be reported as resistant using the 0.1 mg/L cut-off level. |
| Rifampin (RMP) | 1.0 | |
| Ethambutol (EMB) | 5.0 | |
| Pyrazinamide (PZA) | 100.0 | Routine testing is not performed for isolates from British Columbia and Saskatchewan. |
| Anti-tuberculosis drugs | Critical concentration (mg/L) BACTEC® 960 † |
Comments |
|---|---|---|
| Amikacin (AK) | 1 | |
| Capreomycin (CM) | 2.5 | |
| Ethionamide (ETH) | 5 | |
| Kanamycin (KM) | 2.5 | |
| Linezolid (INN) | 1 | |
| Moxifloxacin (MOX) | 0.25 | |
| Ofloxacin (OFL) | 2 | |
| Para-amino salicylic acid (PAS) | 4 | |
| Rifabutin (RBT) | 0.5 | |
| Streptomycin (SM) | 1 |
* Critical concentrations: the lowest concentration of drug that will inhibit 95% of wild strains of MTB that have never been exposed to drugs while at the same time not inhibiting strains of MTB that have been isolated from patients who are not responding to therapy and that are considered resistant.
† Antimicrobial testing methodology with the new technology (BACTEC 960) has been standardized and validated by multiple studies in reference laboratories and is reflected in the new Clinical and Laboratory Standards Institute (CLSI) Standard 1, 2.
Members of the CTLTN participate in the NRCM proficiency testing program. In addition to this national initiative, a number of laboratories also participate in other select external proficiency programs such as the College of American Pathologists, Quality Management Program - Laboratory Services, the United States Centers for Disease Control and Prevention Drug Susceptibility Testing or the New York State Department of Health. All testing methods, including drug selection and concentrations, are done in compliance with the recommended laboratory standards detailed in the CLSI document.
The information presented in this report represents the most up to date information available as of March 2013. The historic record is reviewed annually and adjustments are made to the tables as new/updated information becomes available.
Results
In 2012, anti-tuberculosis drug susceptibility test results for 1,413 isolates were reported to CCDIC-PHAC. Of these, 1,321 (93%) were reported as Mycobacterium tuberculosis, seven (0.5%) were M. africanum, five (0.4%) were M. bovis, and 71 (5.0%) were reported as M. tuberculosis complex (MTBC). An additional 9 (0.6%) isolates were identified as M. bovis BCG and were excluded from further analyses. For this report, the laboratory results for 1,404 isolates were analyzed.
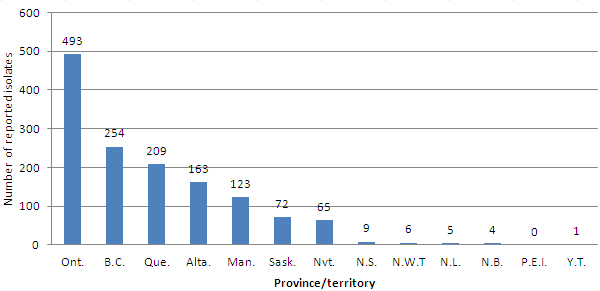
In addition to testing all the isolates from Alberta and six isolates from Northwest Territories, Alberta also tested and reported results for one isolate from Saskatchewan and six from Nunavut. Similarly, British Columbia tested and reported the results for one isolate from Ontario and Ontario tested and reported the results for one isolate from Alberta (Appendix 3, Table 1). Figure 1 provides a breakdown of the number of isolates reported by the province/territory of origin.
Figure 1. Reported Mycobacterium tuberculosis complex isolates in Canada
by province/territory: 2012
| Province/territory | Number of reported isolates |
|---|---|
| Ont. | 493 |
| B.C. | 254 |
| Que. | 209 |
| Alta. | 163 |
| Man. | 123 |
| Sask. | 72 |
| Nvt. | 65 |
| N.S. | 9 |
| N.W.T | 6 |
| N.L. | 5 |
| N.B. | 4 |
| P.E.I. | 0 |
| Y.T. | 1 |
Figure 1- Reported Mycobacterium tuberculosis complex isolates by province/territory: 2012. This bar chart shows the breakdown of the total number of isolates for which drug sensitivity results were reported by the province or territory from which the specimen originated. The horizontal axis names the provinces and territories, and the vertical axis shows the numbers 0 to 600 in increments of 100. For 2012, in descending order, the number of isolates for which reports were submitted by originating province or territory was as follows: Ontario (493), British Columbia (254), Quebec (209), Alberta (163), Manitoba (123), Saskatchewan (72), Nunavut (65), Nova Scotia (9), Northwest Territories (6), Newfoundland and Labrador (5), New Brunswick (4), Yukon (1) and Prince Edward Island (0).
First-line drug resistance
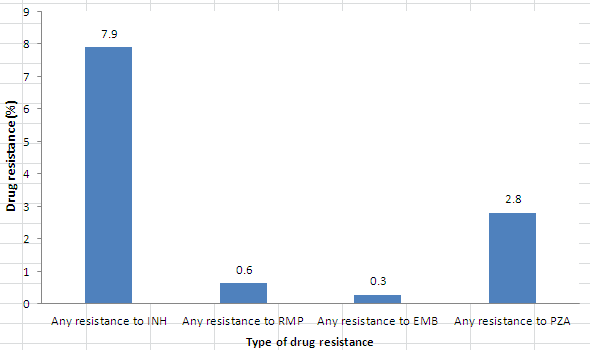
In 2012, all 1,404 isolates were tested for resistance to INH, RMP and EMB, and 1,175 were tested for resistance to PZA. Overall, 138 (9.8%) of the isolates tested were resistant to at least one of the first-line anti-tuberculosis drugs. Resistance to INH was detected in 111 (7.9%) of the isolates tested. Thirty-three (2.8%) isolates were resistant to PZA, 9 (0.6%) to RMP, and 4 (0.3%) to EMB. Figure 2 presents the proportion of the isolates resistant to each of the first-line drugs.
Figure 2. Reported TB drug resistance in Canada by type of first-line drug: 2012
| Type of Drug | Drug resistance (%) |
|---|---|
| Any resistance to INH | 7.9 |
| Any resistance to RMP | 0.6 |
| Any resistance to EMB | 0.3 |
| Any resistance to PZA | 2.8 |
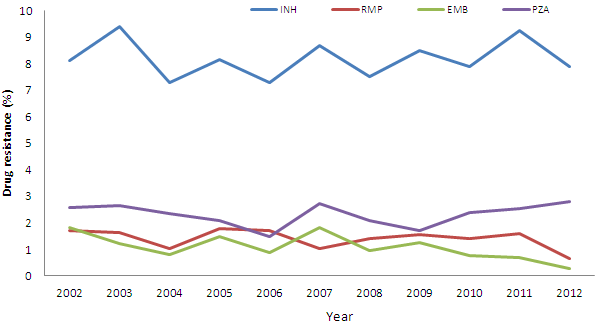
Between 2002 and 2012, trends in the reported prevalence of drug resistance have remained fairly stable. INH resistance was detected in 8% of tested isolates (range: 7.3% - 9.4%). The proportion of isolates in which resistance to EMB or RMP was detected has also remained stable between 2002 and 2011, at less than 2% for each drug. Between 2011 and 2012, a modest decrease the proportion of isolates showing resistance to RMP and EMB was noted.
Between 2002 and 2012, 2.3% of the isolates tested were resistant to PZA (range: 1.5% - 2.8%). With respect to these isolates, 15% were M. bovis, which is known to be inherently resistant to PZA. Since 2009, there has been a modest but slight increase in the proportion of isolates reported to be resistant to PZA (Appendix 3, Table 2)
Figure 3 shows the trends overtime of the proportion of isolates for which any resistance to first-line drugs was detected for the years 2002 to 2012.
Figure 3. Any resistance by type of first-line drug as a percentage of isolates tested:
2002 - 2012
| Any resistance | 2002 | 2003 | 2004 | 2005 | 2006 | 2007 | 2008 | 2009 | 2010 | 2011 | 2012 |
|---|---|---|---|---|---|---|---|---|---|---|---|
| INH | 8.1 | 9.4 | 7.3 | 8.2 | 7.3 | 8.7 | 7.5 | 8.5 | 7.9 | 9.2 | 7.9 |
| RMP | 1.7 | 1.6 | 1.0 | 1.8 | 1.7 | 1.0 | 1.4 | 1.6 | 1.4 | 1.6 | 0.6 |
| EMB | 1.8 | 1.2 | 0.8 | 1.5 | 0.9 | 1.8 | 1.0 | 1.3 | 0.8 | 0.7 | 0.3 |
| PZA | 2.6 | 2.6 | 2.4 | 2.1 | 1.5 | 2.7 | 2.1 | 1.7 | 2.4 | 2.6 | 2.8 |
This line graph shows the eleven year trend, from 2002 to 2012, in the percentage of isolates showing any resistance to each of the four first-line anti-tuberculosis drugs. The horizontal axis displays the reporting year staring at the left with 2002 and going to 2012 at the extreme right. The vertical axis shows percentages going up from 0 to 10% in increments of one. Between 2011 and 2012 there is a noticeable decrease in the percentage of reported resistance to both EMB and RMP. As well, the percentage of isolates showing resistance to PZA has been trending upwards over the past four reporting years (2009 to 2012). Generally, however, for all drugs, although there are minor changes from year to year, the percentage of isolates showing any resistant to a particular drug has remained fairly stable over the time period. The graph shows the following trends: the percentage of isolates showing any resistant to INH ranged from a low of 7.3% in 2006 to a high of 9.4% in 2003. The trend in the percentage of isolates showing any resistant to RMP ranged from a low of 0.6% in 2012 to high of 1.8% in 2005. The trend in the percentage of isolates showing any resistant to EMB ranged from a low of 0.3% in 2012 to high of 1.8% in 2002 and 2007. The trend in the percentage of isolates showing any resistant to PZA ranged from a low of 1.5% in 2006 to high of 2.8% in 2012.
Of the 138 TB isolates reported to be resistant to at least one of the four first line drugs, the majority, 127 (92%) was mono-resistant. Of these, 100 (78%) were resistant to INH, 26 (20%) to PZA and one (2%) was resistant to EMB. Seventy-one of the INH monoresistance isolates were subsequently tested for resistance against second-line TB-drugs. Resistance to MOX was detected in two of the 71 isolates tested and resistance to OFL was detected in a third isolate.
Multidrug-resistant and extensively drug-resistant TB
For 2012, a total of nine isolates were resistant to both INH and RMP, identifying them as at least MDR-TB. Of the nine, four were resistant to INH and RMP alone, two were also resistant to PZA, and three were resistant to all four first-line drugs (INH, RMP, EMB and PZA).
All nine isolates resistant to both INH and RMP were subsequently tested for resistance to second-line drugs to rule out XDR-TB. Of particular interest was the resistance shown to the three injectable agents (amikacin (AK), capreomycin (CM), and kanamycin (KM)) and moxifloxacin (MOX) and ofloxacin (OFL), the fluoroquinolones routinely tested. Seven of the MDR-TB isolates were tested against AK, KM, CM, MOX and OFL; two were not tested against AK.
The results from the additional second-line testing of the MDR-TB isolates found that two of the nine isolates were also resistant to KM, one isolate was resistant to both OFL and MOX and a fourth isolate was resistant to CM. Of the nine isolates resistant to INH and RMP, additional testing identified one that was resistant to KM, MOX and OFL, thus identifying that isolate as XDR-TB. The final results of second-line testing confirmed eight MDR-TB isolates and identified one XDR-TB isolate (Appendix 3; Table 3).
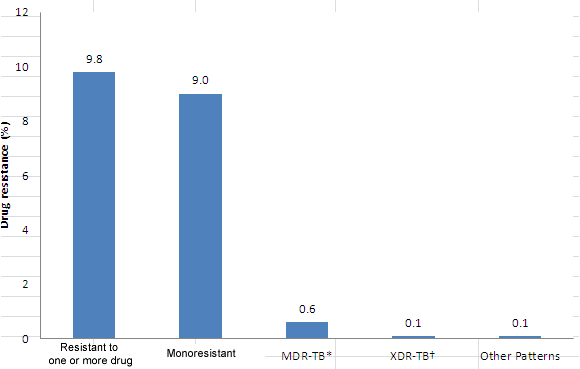
Figure 4 presents the overall proportions in 2012 for each of the reported resistance patterns.
Figure 4: Overall pattern of reported TB drug resistance in Canada: 2012
| Type of resistance | Drug resistance (%) |
|---|---|
| Resistant to one or more drugs | 9.8 |
| Monoresistant | 9.0 |
| MDR-TB* | 0.6 |
| XDR-TB† | 0.1 |
| Other Patterns | 0.1 |
This bar graphs shows, for all the reported results, the percentage of the total number of isolates tested in 2012 that were resistant by the type of resistance. The horizontal shows the type of resistance evaluated and includes: isolates resistant to one or more of the first line TB drugs (INH, RMP, EMB or PZA); isolates that are monoresistant (isolates resistant to only one of the first line TB drugs isolates that are multidrug-resistant (MDR) TB (resistant to at least isoniazid and rifampin, but which do not meet the definition of XDR-TB); isolates that are extensively drug-resistant (XDR) TB (resistant to at least the two best first-line drugs isoniazid and rifampin plus resistant to second-line drugs including any fluoroquinolone and at least one of three injectable agents (amikacin, capreomycin and kanamycin); and other patterns. The vertical axis displays the percentage ranging for 0 to 12% in increments of two. Resistance to one or more of the drugs tested was reported in 9.8% of tested isolate; monoresistance was reported for 9.0% of tested isolates; MDR-TB was reported for 0.6% of tested isolates; XDR-TB reported for 0.1%; and other patterns of resistance was reported for 0.1% of tested isolates.
Between 2002 and 2012, a total of 176 isolates have been classified as MDR-TB, representing 1.2% of all isolates tested during that period.
Fluoroquinolones including ofloxacin and moxifloxacin, represent the most powerful class of bactericidal second-line drugs for the treatment of MDR-TB. Patients with MDR-TB and additional resistance to fluoroquinolones have a more serious form of disease compared to those with MDR-TB alone. Their disease is more difficult to treat, and risks evolving into XDR-TB and acquiring resistance to any of the second-line injectable agents. Between 2002 and 2012, of the isolates found to be resistant to both INH and RMP, 14% were also resistant to a fluoroquinolone.
Between 2002 and 2012, results of second testing identified 7 isolates (0.05% of all those tested) classified as XDR-TB.
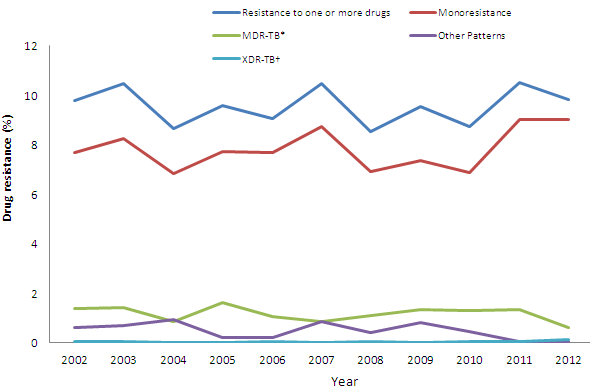
Figure 5 displays these proportions over time. Table B present the breakdown of the numbers of MDR-TB and XDR-TB isolates reported between 2002 and 2012.
Figure 5: Overall pattern of reported TB drug resistance as a percentage of isolates tested: 2002 - 2012
| 2002 | 2003 | 2004 | 2005 | 2006 | 2007 | 2008 | 2009 | 2010 | 2011 | 2012 | |
|---|---|---|---|---|---|---|---|---|---|---|---|
| Resistance to one or more drugs | 9.8 | 10.5 | 8.6 | 9.6 | 9.1 | 10.5 | 8.6 | 9.5 | 8.8 | 10.5 | 9.8 |
| Monoresistance | 7.7 | 8.3 | 6.8 | 7.7 | 7.7 | 8.8 | 6.9 | 7.4 | 6.9 | 9.0 | 9.0 |
| MDR-TB* | 1.4 | 1.4 | 0.9 | 1.6 | 1.1 | 0.9 | 1.1 | 1.4 | 1.3 | 1.4 | 0.6 |
| Other Patterns | 0.6 | 0.7 | 0.9 | 0.2 | 0.2 | 0.9 | 0.4 | 0.8 | 0.5 | 0.1 | 0.1 |
| XDR-TB† | 0.1 | 0.1 | - | - | 0.1 | - | 0.1 | - | 0.1 | 0.1 | 0.1 |
* Multidrug-resistant TB (MDR-TB) is TB that is resistant to at least isoniazid and rifampin, but which does not meet the definition of XDR-TB. † Extensively drug-resistant TB (XDR-TB) is TB that is resistant to at least the two best first-line drugs isoniazid and rifampin plus resistant to second-line drugs including any fluoroquinolone and at least one of three injectable agents, amikacin, capreomycin and kanamycin. |
|||||||||||
This line graph shows the eleven year trend, from 2002 to 2012, in the percentage of isolates showing resistance based on the pattern of resistance to anti-TB medication. The type of resistance evaluated includes: isolates resistant to one or more of the first-line TB drugs (INH, RMP, EMB or PZA); isolates that are monoresistant (isolates resistant to only one of the first-line TB drugs); isolates that are multidrug-resistant (MDR) (resistant to at least isoniazid and rifampin, but which do not meet the definition of XDR); isolates that are extensively drug-resistant (XDR) (resistant to at least the two best first-line drugs isoniazid and rifampin plus resistant to second-line drugs including any fluoroquinolone and at least one of three injectable agents (amikacin, capreomycin and kanamycin); and other patterns. The percentage of isolates showing any resistance ranged from a low of 8.0% in 2001 to a high of 10.5% in 2003 and 2007. The percentage of isolates that was resistant to only one drug, or were monoresistant, ranged from a low of 6.5% in 2001 to a high of 8.8% in 2007. The percentage of isolates that was identified as multidrug-resistant ranged from 0.9% in 2004 and 2007 to a high of 1.6% in 2005. The percentage of isolates showing other patterns of resistance not mono-resistant nor multi-drug resistance, ranged from 0.2% in 2005 and 2006 to 0.9% in 2004. Finally, the percentage of isolates that was classified as extensively drug resistant ranged from 0 in to 0.1%. As of March 2012, the CTBLSS has reported 7 XDR-TB cases, 1 in each of 2002, 2003, 2006, 2008 , 2010, 2011 and 2012.
* Does not include the XDR-TB |
|||
| Year | Total number of isolates | MDR-TB* (%) | XDR-TB (%) |
|---|---|---|---|
| 2002 | 1419 | 20 (1.4%) | 1 (0.1%) |
| 2003 | 1405 | 20 (1.4%) | 1 (0.1%) |
| 2004 | 1376 | 12 (0.9%) | 0 |
| 2005 | 1335 | 22 (1.6%) | 0 |
| 2006 | 1389 | 15 (1.1%) | 1 (0.1%) |
| 2007 | 1267 | 11 (0.9%) | 0 |
| 2008 | 1356 | 15 (1.1%) | 1 (0.1%) |
| 2009 | 1331 | 18 (1.4%) | 0 |
| 2010 | 1279 | 17 (1.3%) | 1 (0.1%) |
| 2011 | 1319 | 18 (1.4%) | 1 (0.1%) |
| 2012 | 1404 | 8 (0.6%) | 1 (0.1%) |
| Total | 14880 | 176 (1.2%) | 7 (0.05%) |
Demographic information
For 2012 age was available for all 1,404 of the isolates tested. Sixty-one percent of the isolates were from individuals between the ages of 15 and 54 years. Twenty-one percent of isolates were between 55 and 74 years of age and 15% of the reported cases were 75 years of age or older. Three percent of reported isolates were from individuals under 15 years of age.
Sex was known for 1,390 of the reported isolates. Males accounted for 59% of these isolates and 64% of the 138 isolates in which resistance was detected. However, 100% of the MDR-TB isolates were from females; five of these were under the age of 35. The XDR-TB isolate was from a male in the 15-24 year age group (Appendix III; Table 4).Stratifying the laboratory results by sex and age group found that among females, the greatest proportion (57%) of resistance was in individuals between 25 and 44 years of age. For males, however, isolates in which drug resistance was detected were distributed more evenly across all the age groups.
Geographical distribution
Figure 6 presents the geographical distribution of drug resistance across Canada in 2012. Eighty percent of the laboratory results were for isolates originating from Alberta, British Columbia, Ontario and Quebec combined. Seven provinces reported at least one isolate that was resistant to at least one of the anti-tuberculosis drugs. For the Northwest Territories, Nunavut, Yukon, and three Atlantic provinces all isolates tested were fully susceptible to all first line drugs tested. The nine isolates resistant to both INH and RMP, originated from Alberta, British Columbia and Ontario.
Figure 6: Reported TB drug resistance in Canada by province/territory: 2012
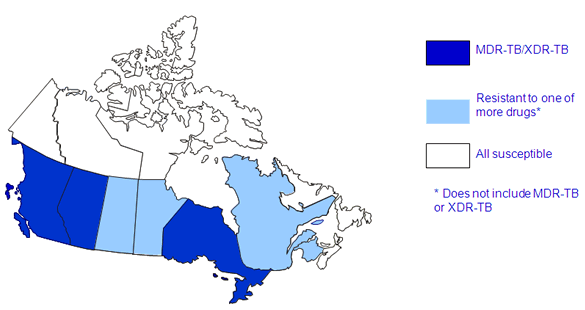
This map of Canada, with the provinces and territories variously highlighted, shows the highest level of drug-resistance reported from each province and territory for 2012. Newfoundland and Labrador, Northwest Territories, Nova Scotia, Nunavut, Prince Edward Island and Yukon are shaded white indicating that all isolates tested were susceptible to all first-line drugs. Manitoba, New Brunswick, Quebec and Saskatchewan are shaded light blue indicating that, of all the results reported, at least one of the isolates tested in each province was resistant to one or more of the TB drugs but does not include the isoniazid and rifampin combination. Alberta, British Columbia and Ontario are shaded dark blue, indicating that of all the results reported that at least one isolate tested from each province was identified as either MDR-TB or XDR-TB.
Between 2002 and 2012, 82% of all the laboratory reports originated from Alberta, British Columbia, Ontario and Quebec, combined.. Together, these four provinces reported 92% of all isolates showing resistance and 95% of the MDR-TB isolates. Ontario reported 47% of all isolates showing any resistance and 59% of all MDR-TB reports. Between 2002 and 2012, only Manitoba and Ontario reported XDR-TB isolates. Table C presents the provincial/territorial distribution of isolates tested and the proportion of isolates for which resistance was detected for the years 2002 to 2012.
| Province/Territories | Total number of Isolates | Any resistance | MDR-TB* | XDR-TB |
|---|---|---|---|---|
* Does not include XDR-TB | ||||
| Ontario | 5896 | 664 (11.3%) | 104 (1.8%) | 5 (0.1%) |
| British Columbia | 2668 | 251 (9.4%) | 25 (0.9%) | 0 (0.0%) |
| Quebec | 2292 | 246 (10.7%) | 18 (0.8%) | 0 (0.0%) |
| Alberta | 1344 | 137 (10.2%) | 21 (1.6%) | 0 (0.0%) |
| Manitoba | 1 209 | 73 (6.0%) | 6 (0.5%) | 2 (0.2%) |
| Saskatchewan | 678 | 30 (4.4%) | 2 (0.3) | 0 (0.0%) |
| Nunavut | 433 | 5 (1.2%) | 0 (0.0%) | 0 (0.0%) |
| Northwest Territories | 89 | 3 (3.4%) | 0 (0.0%) | 0 (0.0%) |
| Nova Scotia | 80 | 5 (6.3%) | 0 (0.0%) | 0 (0.0%) |
| New Brunswick | 79 | 7 (8.9%) | 0 (0.0%) | 0 (0.0%) |
| Newfoundland and Labrador | 74 | 3 (4.1%) | 0 (0.0%) | 0 (0.0%) |
| Yukon | 28 | 0 (0.0%) | 0 (0.0%) | 0 (0.0%) |
| Prince Edward Island | 10 | 1 (10.0%) | 0 (0.0%) | 0 (0.0%) |
| Total | 14880 | 1425 (9.6%) | 176 (1.2%) | 7 (0.05%) |
For a complete review of the resistance patterns by province/territory, refer to tables 5 through 17 (Appendix 3, Table 5-17).
Discussion
In many parts of the world, the increase in drug resistance is a major challenge in efforts to control and manage TB disease. Available data confirm that Eastern Europe and central Asia continue to have the world's highest proportion of MDR-TB among TB cases.3
Between 2002 and 2012, reported drug resistance in Canada remained consistently below international levels. Overall, there has been no significant change in the proportion of isolates showing any resistance to first-line medication over the 11 years analyzed in this report. In each of the past 3 years (2010-2012), there has been 1 XDR-TB result reported and between 2002 and 2012, there have been a total of seven XDR-TB isolates identified in the CTBLSS.
Susceptibility results were reported for 1,404 isolates in 2012. The proportion of the total number of isolates which demonstrated any type of drug resistance was 9.8%, a slight decrease from the previous year. Although there was one reported XDR-TB result in 2012, the proportion of isolates classified as MDR-TB fell from 1.4% in 2011 to 0.6% in 2012.
Organisms resistant to both INH and RMP pose a considerable challenge in treatment and prevention efforts by limiting the availability of effective anti-tuberculosis drug. Globally, 3.7% (2.1–5.2%) of new cases and 20% (13–26%) of previously treated cases are estimated to have MDR-TB. Compared with international reports, results observed to date in the CTBLSS show that the prevalence of MDR-TB in Canada remains low.3
Extensively drug-resistant tuberculosis is a growing international concern. Because XDR-TB isolates are resistant to the best first- and some of the best second-line drugs, treatment options are seriously limited. To continue surveillance of XDR-TB in Canada, all isolates resistant to both INH and RMP or monoresistant to RMP are recommended to be routinely tested for resistance to second-line antibiotics. The results presented here indicate that these recommendations are generally being followed.
Limitations
Typically, only isolates with MDR-TB or other extensive resistance patterns will receive drug sensitivity testing to select second-line drugs. Although the CLSI recommends that INH monoresistant isolates, as well as other poly-resistant, non-MDR isolates, be tested for second-line drug resistance, this is not universally reported in Canada. Other isolates may be resistant to a fluoroquinolone because of widespread use for respiratory infections, but not be MDR-TB. This limits the understanding of the emergence of second-line resistance within Canada.
Additional demographic and clinical information on individuals from whom the TB isolates were obtained would facilitate more in-depth epidemiologic assessment of drug resistance patterns in Canada. For example, with only the year of birth and sex of the individual available, no differentiation can be made between primary and secondary/acquired drug resistance and differing resistance patterns for new cases versus re-treatment cases from data in this system. However, the annual Tuberculosis in Canada reports provide more detailed information on TB drug resistance including information on primary and acquired drug resistance.
Conclusions
Surveillance data on drug resistance are used to track the effectiveness of TB prevention and control activities; accurately forecast the need for patient treatments and plan accordingly; design standardized regimens for the treatment of drug-resistant TB; assess epidemiological trends; and promptly identify and respond to outbreaks of drug-resistant TB. Data collected to date indicate that the presence of TB drug resistance in Canada is below the global average and has remained stable since reporting began. However, with growing worldwide concern regarding resistance and with the emergence of extensively drug-resistant tuberculosis, surveillance systems such as the CTBLSS are vital in helping to inform tuberculosis control and prevention strategies.
[Table of Contents] [Next page]
References
- Footnote 1
- Clinical and Laboratory Standards Institute. (CLSI) Susceptibility Testing of Mycobacteria, Nocardiae, and Other Aerobic Actinomycetes; Approved Standard, M24-A. Clinical and Laboratory Standards Institute, 2011.
- Footnote 2
- Sharma et al. A Canadian Multicentre Laboratory Study for Standardized Second-line Antimicrobial Susceptiblity Testing of Mycobacterium tuberculosis. Journal of Clinical Microbiology, 2011, 49 (12), 4112-4116.
- Footnote 3
- World Health Organization. Global tuberculosis report 2012. Geneva,: World Health Organization, 2006 (WHO/HTM/TB/2012.6).
a The Canadian Tuberculosis Laboratory Technical Network is a national network made up of a technical head of each provincial or territorial laboratory that performs Mycobacteriology testing, a representative from the National Reference Centre for Mycobacteriology, Public Health Agency of Canada (the Agency), and a designee from CCDIC the Agency.

To share this page just click on the social network icon of your choice.